There are lots of sayings in medicine, often recited by grumpy old doctors like me, to remind more junior staff how medicine “works”, or once worked!! Sayings like “if you hear hooves, think horses”, “common things are common” or “as rare as hen’s teeth”. All of these mean that a patient’s symptoms are usually explained by a common disease rather than a rare one and that treatment and investigations should be targeted at the common diagnoses rather than something more obscure.
Note: those doing exams are often the worst offenders as they are cramming obscure knowledge in order to cover “everything possible” that an exam might test them on, even if it is as rare as hens teeth!
But why do we say this? What is wrong with sending every test you can possibly think of for every possible disease, however rare, that might explain the patient’s symptoms? How do Doctors choose what tests to perform and have you ever considered how reliable the results that come back are!? You might be shocked to know that not all tests are completely accurate.
Okay, bear with me on this. The science is complicated and involves statistics… (stay with me everyone!!!) but it’s a fundamental part of medicine so I’m going to stick with it, come on, come with me… there is a “are you still confused” recap at the end, honest you will get it, Editor-Chief-in-Charge wrote it and she doesn’t do stats!

True: No microbiology test is 100% accurate. This may sound odd but I’m afraid if you are relying on the test being 100% accurate you are wrong, they never are but many people forget this.
When interpreting results you are not concerned about whether a positive result is a true positive or a negative is a true negative because you expect all positive results to only occur in patients who have the disease (true positive, TP) and all negative results to occur in those without disease (true negative, TN). Unfortunately life isn’t so simple; results are not always that clear cut or reliable! Some positive results occur in patients without disease (false positive, FP) and some negative results occur in patients with the disease (false negative, FN).
When performing laboratory tests it is important to know how likely the test is to be positive or negative to give an indication of the risk of a false positive or false negative result. The likelihood of a false result is based upon the probability of a true positive or true negative and is shown by the Positive or Negative Predictive Value (PPV or NPV).
PPV and NPV are dependent upon how common the infection is in the population being studied, so a test for a common infection will have a higher PPV and a lower NPV whereas a test for a rare infection will have a lower PPV and a higher NPV.
If an infection is extremely unlikely then any positive test is almost certainly a false positive and any negative test is a true negative. The PPV is virtually 0%; the NPV is probably 100%, so it isn’t necessary to do the test in the first place. For example, acute poliomyelitis (polio) can cause flaccid paralysis but if a patient has never left the UK the chance of them having polio is almost 0% because they won’t have come into contact with someone with polio. Therefore don’t test them for polio as the inherent inaccuracy of the test might just produce a positive result, but as polio has been eradicated in Europe the result is clearly wrong. Laboratory testing is not 100% accurate.
The next step in trusting a result is the likelihood ratios which represent how likely it is that a patient will have a particular infection if they have a positive or negative test. Likelihood ratios are calculated using a standard statistical equation (see below) from the sensitivity and specificity of the test in that specific patient population compared to a known/confirmed result. This “validates” the test against the known result.
For example, if you want to calculate the sensitivity and specificity of a urine dipstick in women you first need to test how effective a urine dipstick is in diagnosing a UTI in this population group. If you take 200 women (100 with confirmed UTI and 100 without a UTI) and test their urine with a urine dipstick, the results would look like this:
When interpreting results you are not concerned about whether a positive result is a true positive or a negative is a true negative because you expect all positive results to only occur in patients who have the disease (true positive, TP) and all negative results to occur in those without disease (true negative, TN). Unfortunately life isn’t so simple; results are not always that clear cut or reliable! Some positive results occur in patients without disease (false positive, FP) and some negative results occur in patients with the disease (false negative, FN).
When performing laboratory tests it is important to know how likely the test is to be positive or negative to give an indication of the risk of a false positive or false negative result. The likelihood of a false result is based upon the probability of a true positive or true negative and is shown by the Positive or Negative Predictive Value (PPV or NPV).
- PPV is the percentage of genuine positive tests for an infection e.g. PPV of 60% means that 60% of people with a positive test have the infection, however it also means 40% of patients with a positive test actually do not have the infection (false positives)
- NPV is the percentage of genuine negative tests for an infection e.g. NPV of 97% means that 97% of people with a negative test do not have the infection, however it also means 3% of patients with a negative test actually do have the infection (false negatives)
PPV and NPV are dependent upon how common the infection is in the population being studied, so a test for a common infection will have a higher PPV and a lower NPV whereas a test for a rare infection will have a lower PPV and a higher NPV.
If an infection is extremely unlikely then any positive test is almost certainly a false positive and any negative test is a true negative. The PPV is virtually 0%; the NPV is probably 100%, so it isn’t necessary to do the test in the first place. For example, acute poliomyelitis (polio) can cause flaccid paralysis but if a patient has never left the UK the chance of them having polio is almost 0% because they won’t have come into contact with someone with polio. Therefore don’t test them for polio as the inherent inaccuracy of the test might just produce a positive result, but as polio has been eradicated in Europe the result is clearly wrong. Laboratory testing is not 100% accurate.
The next step in trusting a result is the likelihood ratios which represent how likely it is that a patient will have a particular infection if they have a positive or negative test. Likelihood ratios are calculated using a standard statistical equation (see below) from the sensitivity and specificity of the test in that specific patient population compared to a known/confirmed result. This “validates” the test against the known result.
For example, if you want to calculate the sensitivity and specificity of a urine dipstick in women you first need to test how effective a urine dipstick is in diagnosing a UTI in this population group. If you take 200 women (100 with confirmed UTI and 100 without a UTI) and test their urine with a urine dipstick, the results would look like this:
UTI |
No UTI |
||
+ve dipstick |
77 (true positive) |
30 (false positive) |
107 |
-ve dipstick |
23 (false negative) |
70 (true negative) |
93 |
100 |
100 |
200 |

Click for larger image
These figures can now be used to calculate the two likelihood ratios; one is called the +ve likelihood ratio, the other is called the –ve likelihood ratio. The +ve likelihood ratio indicates the possibility that a positive test result is a genuine positive; the –ve likelihood ratio indicates the possibility that a negative result is actually incorrect.

Click for larger image
REMEMBER: likelihood ratios represent how likely it is that a patient will have a particular infection if they have a positive or negative test.
The likelihood ratios are combined with the pre-test probability of the infection (the prevalence of a specific infection within the population, expressed as a percentage) to give post-test probabilities of the infection. This uses the Fagan nomogram.
The likelihood ratios are combined with the pre-test probability of the infection (the prevalence of a specific infection within the population, expressed as a percentage) to give post-test probabilities of the infection. This uses the Fagan nomogram.
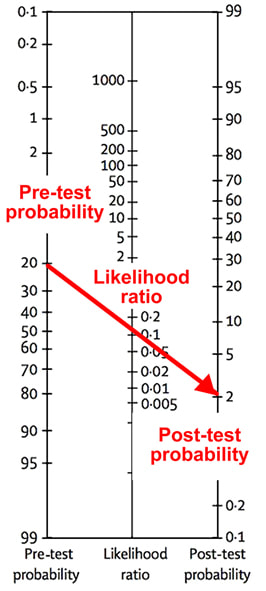
Starting with the pre-test probability value on the left axis (e.g. 20%), draw a straight line through the likelihood ratio value on the middle axis (e.g. 0.1), and end the line on the post-test probability value on the right axis (e.g. 2%). The post-test probability is the probability of the patient having the infection when the test result is known e.g. only 2%, or 2 in 100 people.
The test, in this example, would be poor at diagnosing the disease if you were using the +ve likelihood ratio as only 2% of patients with a positive result would have the disease. However, it would be a good test for excluding a diagnosis if you were using the –ve likelihood ratio as only 2% of patients with a negative result would actually have the disease.
Both need to be plotted on a chart giving 2 post-test probability results; to work out how likely a positive test result indicates the patient does have an infection, and how likely a negative result indicates that the patient doesn’t have an infection. In the clinical examples below the red line uses the +ve likelihood ratio and the blue line uses the –ve likelihood ratio.

Click for larger image

Click for larger image

Click for larger image
Are you still confused?
Let’s look at this in a non-medical analogy. The chances of me getting a Husky dog, with its strong prey drive to eat my cats, means there is a very low “pre-test probability” that I will have a Husky. Whereas a Field Spaniel, which is unlikely to attack my cats, means there is a higher “pre-test probability” that I will have a Field Spaniel. However the “+ve likelihood ratio” that my wife would allow me to have any dog is very low as she doesn’t really like dogs. With these factors combined the “post-test probability” that we will ever get a Husky is extremely low i.e. it will never happen, whereas having a Field Spaniel, whilst still unlikely, is more likely than having a Husky. Alternatively the “pre-test probability” and the “likelihood ratio” of us having more cats are both very high; therefore it is almost inevitable we will get a sixth cat!
So there you have it. You really shouldn’t do every test for every possible diagnosis for a patient. You will get false positive results which may lead you to the wrong conclusion and therefore the wrong treatment and while you are treating the patient incorrectly you will not be treating them for the condition they do have and that is clearly wrong.
So think about common diagnoses and test for them; if something is very unlikely then don’t even do the test. If the patient needs urgent treatment then treat for the most likely diagnosis whilst waiting for the results to come back. It’s good medicine and it’s good for patients…
 RSS Feed
